Example full output for the different
running modes:
Guided tour:
- Suppose you are interested in Hepatitis B Virus NCBI GenBank accession
number AB014366. The first step is to obtain a set of related
sequences. You could do this via the NCBI blast site.
Alternatively, for viruses, you could use the NCBI viral
genomes or taxonomy
databases.
- Align the sequences and obtain a phylogenetic tree pairs file
here. Alternatively, you
could use e.g. PHYLIP to calculate a phylogenetic tree and convert
it a pairs file here.
- Annotate the known CDSs in the reference sequence. E.g. for
AB014366 you can use the NCBI GenBank annotation
(the CDS lines). Be aware that the GenBank annotation is sometimes
incomplete.
- Now you are ready to go to the MLOGD base page here.
- If you have a specific query CDS (e.g. a long ORF that has not
previously been annotated as a CDS, but that you suspect may be a
CDS) then use the 'Test input query CDSs' option. Input the query
CDS location and click on 'Calculate'. The results page gives:
- Null versus alternate model likelihood ratio statistics,
where the null model is that the query ORF is not coding while the
alternate model is that the query ORF is coding (both the null and
alternate models include the annotated CDSs).
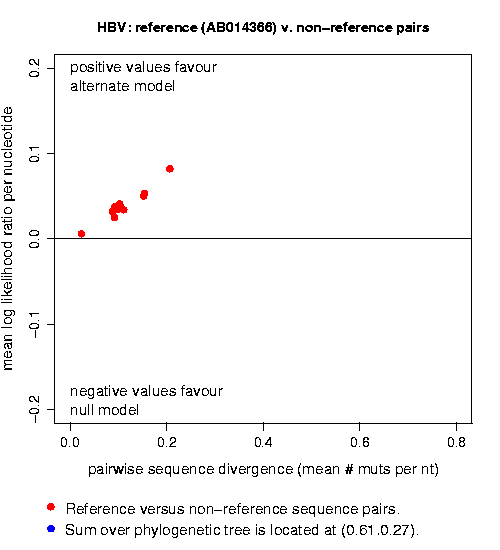
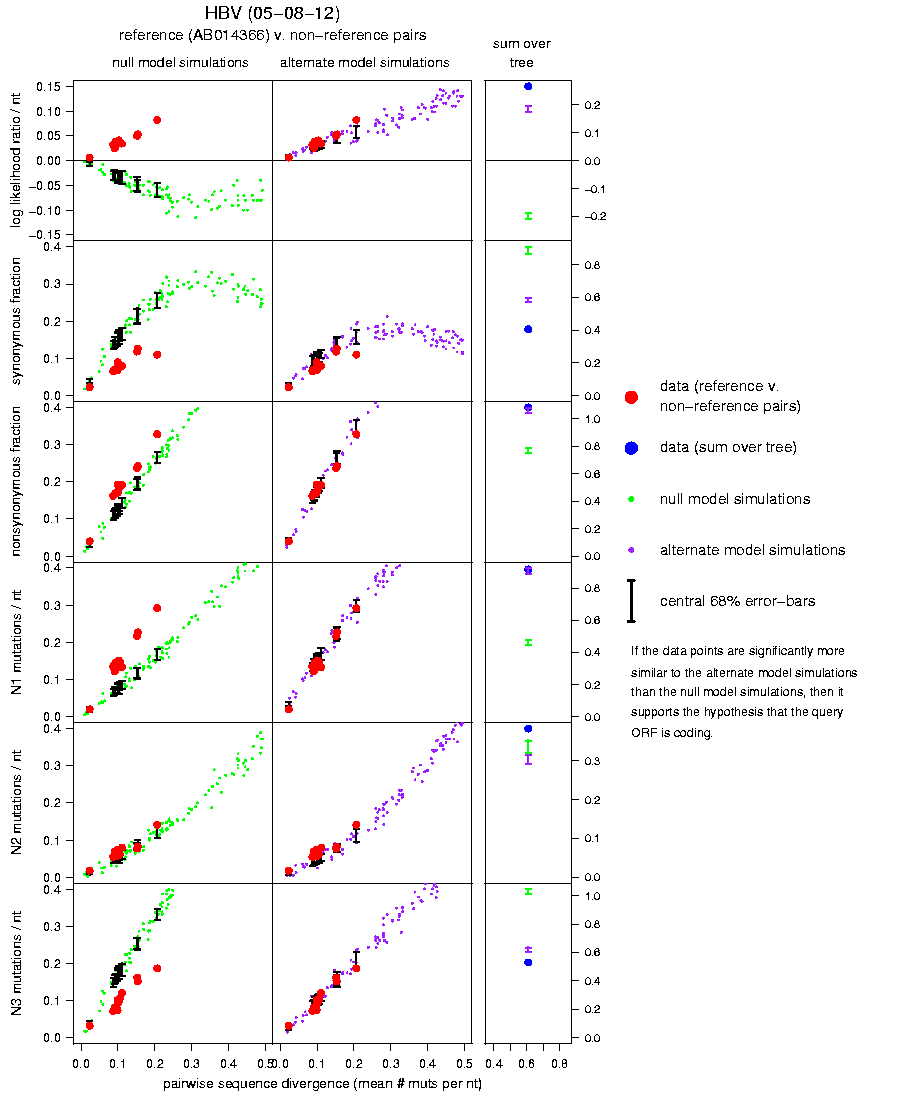
- A plot of the likelihood ratio statistics (example plot). You may follow a link
here to generate simulated sequences under the same null and
alternate models. The simulations are used to put error bars on
the likelihood ratio statistics, and to interpret the
synonymous/nonsynonymous and N1/N2/N3 statistics (example plot).
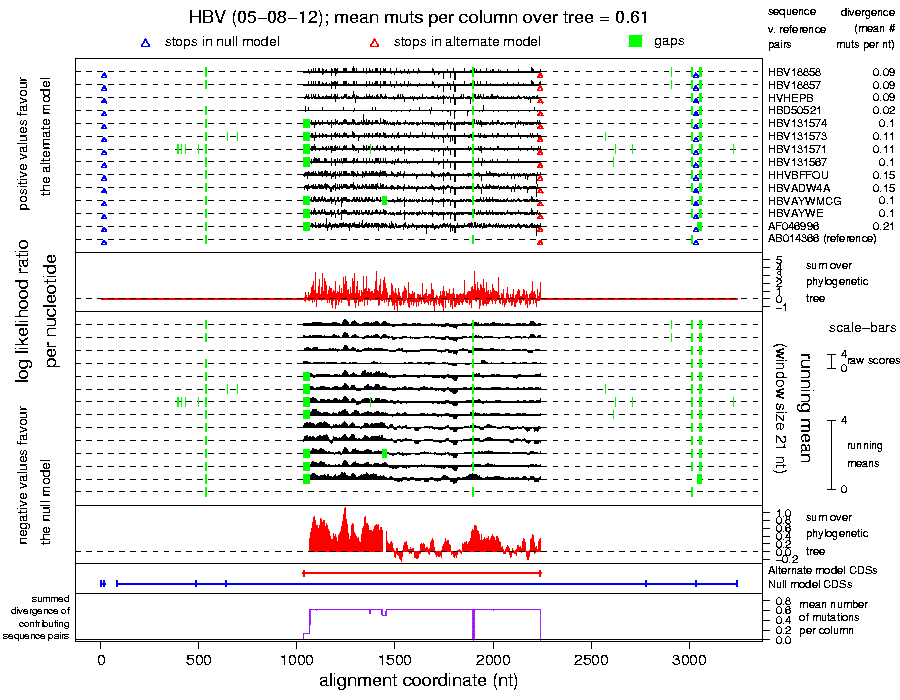
- A nucleotide-by-nucleotide plot of the likelihood ratio
statistic for each reference - non-reference sequence pair and
summed over the phylogenetic tree (example
plot). Gaps and stop and start codons for each sequence are also
annotated on the plot. You may follow a link here to zoom in on
the plot, add grid lines, or adjust the running-mean window size.
There is also a zoomed in version of this plot (example plot).
- If you don't have a specific query CDS, you may either select
the 'Find and test all non-annotated ORFs' option, or select the
'Six-frame sliding window plots' option.
- The 'Find and test all non-annotated ORFs' option will find all
non-annotated ORFs and produce the same statistics and plots as the
'Test input query CDSs' option for each of these ORFs.
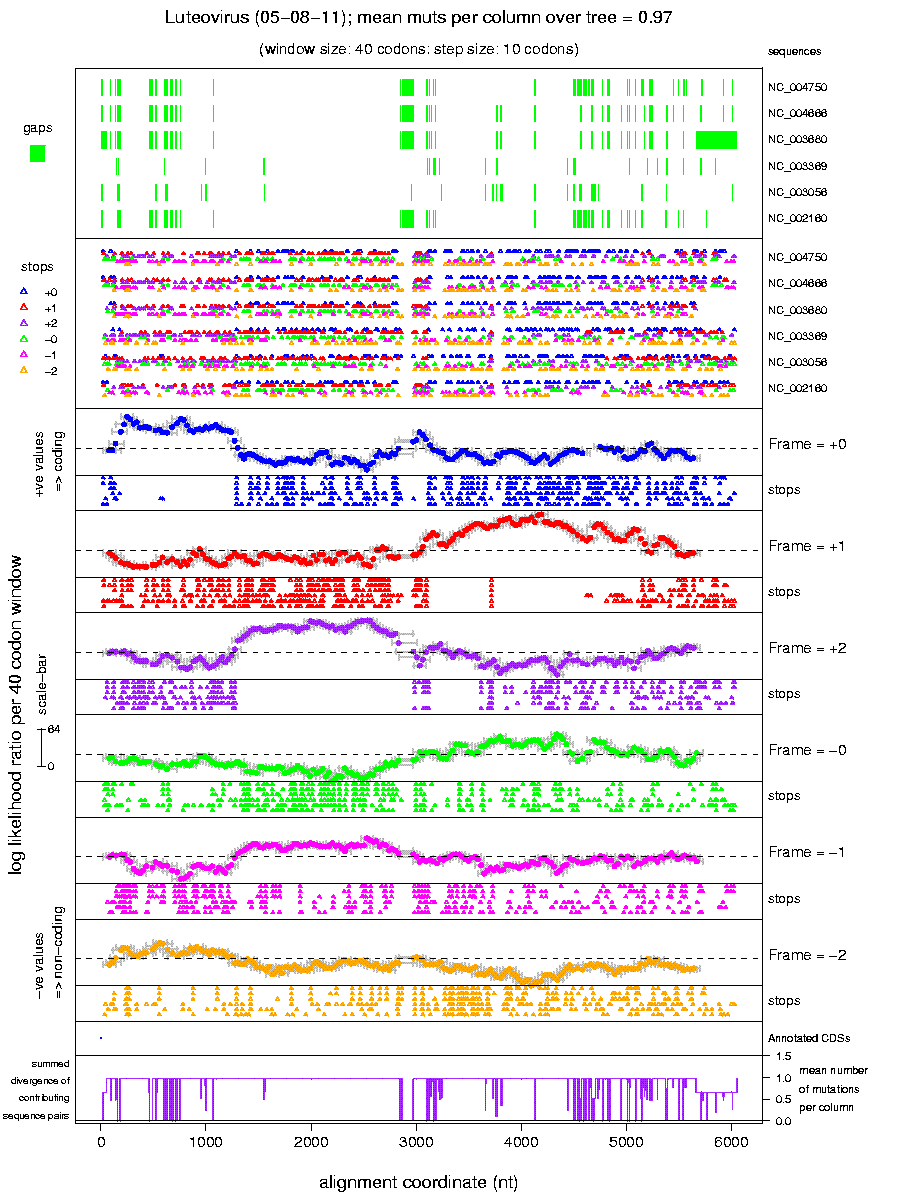
- The 'Six-frame sliding window plots' option will calculate the
MLOGD statistic in a window sliding along the alignment in all six reading
frames (example plot). Extended regions
of positive signal may indicate potential new CDSs, especially where
there is an absense of stop codons. Once you have located any
potentially interesting regions, you can then go back to the 'Test
input query CDSs' option to investigate these regions in more
detail.